
About
Purpose and background
The Climate Indices for Pacific Sectoral Applications Portal (CIPSA portal) - previously known as the Pacific Climate Change Data Portal (PCCDP) - provides access to historical climate information from observation sites across the Pacific and Australia. This information includes trends and climatologies of meteorological means and extremes relevant to multiple sectors such as health, agriculture and water security. The portal allows quick comparisons across international borders and puts changes in climate at individual sites into a Pacific-wide context.
The CIPSA portal first released in 2009 and was based on a similar product for Australia, the Australian climate change site network. During the third phase of the Australian and New Zealand Aid funded Climate and Ocean Support Program in the Pacific (COSPPac, 2023-2027) the CIPSA portal was redesigned and renamed to adhere to the latest web and accessibility standards and to reflect the evolving needs of its users. By funding its continued development COSPPac assists vulnerable countries in the Pacific to meet high-priority climate change adaptation needs.
The CIPSA portal was initially developed under the Australian Aid funded Pacific Climate Change Science Program (PCCSP; 2009-2011) with further development undertaken during the Pacific-Australia Climate Change Science Adaptation Planning (PACCSAP) Program (2011-2014) and the first and second phases of COSPPac (2015-2022).
Data types
The CIPSA portal provides historical point-based climate data from observation stations across the Pacific. Available climate variables include temperature and rainfall at daily, monthly, seasonal and annual timescales.
Pre-homogenised and homogenised data
Each station hosted on the CIPSA portal has a pre-homogenised dataset that contains - if all three variables are observed – maximum temperature, minimum temperature and rainfall. These datasets have undergone basic quality control checks, sometimes by both COSPPac and the host National Meteorological and Hydrological Service (NMHS) and sometimes only by COSPPac. The daily temperature range and daily mean temperature are also calculated if both maximum and minimum temperatures exist.
For stations where the pre-homogenised timeseries are sufficiently long and complete and do not have severe quality issues, a second homogenised dataset is created. Homogenised timeseries have adjustments applied to them to correct changes that are not related to the climate. These "inhomogeneities" are typically caused by changes in instrumentation, station location or the surrounding environment. Without performing homogenisation, these non-climatic changes can provide misleading long-term trends. Both temperature and rainfall are checked for homogeneity, however, only temperature timeseries have corrections applied. Temperature data is only adjusted where there is supporting metadata evidence or strong statistical evidence.
For climate change analysis, homogenised data should be used.
Climate extremes indices
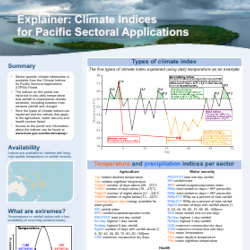
Changes in climate are most acutely felt by communities through changes in extreme weather. To understand if and how extremes have changed historically climate extremes indices calculated from daily rainfall and temperature data are presented. These are based on indices endorsed by the World Meteorological Organisation (WMO) and calculated with the Climpact software. These indices are relevant to multiple sectors such as health, agriculture and water security. These indices are relevant to multiple sectors such as health, agriculture and water security. They are calculated using the pre-homogenised and homogenised timeseries and are defined in Table 1.
Table 1. Climate extremes indices available on the CIPSA portal.
TX = daily maximum temperature, TN = daily minimum temperature, TM = daily mean temperature, DTR = daily temperature range, PR = rainfall.
| Long name | Definition | Units | Time scale |
|---|---|---|---|
| Hottest daytime temperature | Maximum of daily maximum temperatures | °C | Mon/Ann |
| Coldest nighttime temperature | Minimum of daily minimum temperatures | °C | Mon/Ann |
| Warmest nighttime temperature | Maximum of daily minimum temperatures | °C | Mon/Ann |
| Coolest daytime temperature | Minimum of daily maximum temperatures | °C | Mon/Ann |
| Number of cool days | Number of days when TX is below a chosen threshold. The threshold can be selected from:
| days | Mon/Ann |
| Number of hot days | Number of days when TX is above a chosen threshold. The threshold can be selected from:
| days | Mon/Ann |
| Number of cold nights | Number of days when TN is below a chosen threshold. The threshold can be selected from:
| days | Mon/Ann |
| Number of warm nights | Number of days when TN is above a chosen threshold. The threshold can be selected from:
| days | Mon/Ann |
| Warm spell duration indicator | Annual number of days contributing to events where n or more consecutive days experience TX > 90th percentile. n can be selected from 3 or 6 days. | days | Ann |
| Cold spell duration indicator | Annual number of days contributing to events where n or more consecutive days experience TN < 10th percentile. n can be selected from 3 or 6 days. | days | Ann |
| Percentage of days with temperatures above the median temperature | Percentage of days where TX > 50th percentile | % | Mon/Ann |
| Consecutive number of hot days and nights | Annual number of days contributing to events where 3 consecutive days have both TX > 95th percentile and TN > 95th percentile | events | Ann |
| Cooling Degree Days | Annual sum of TM – 25, for days when TM > 25. Indicates the amount of energy required to cool buildings to a comfortable temperature of 25°C. | degree-days | Ann |
| Consecutive Dry Days | Maximum number of consecutive dry days (when PR < 1.0 mm) | days | Ann |
| Total wet-day PR | Sum of daily PR >= 1.0 mm | mm | Mon/Ann |
| Total annual PR from heavy rain days | Annual sum of daily PR > 95th percentile | mm | Ann |
| Total annual PR from very heavy rain days | Annual sum of daily PR > 99th percentile | mm | Ann |
| Contribution to annual rainfall from heavy rain days | 100*r95p / PRCPTOT | % | Ann |
| Contribution to annual rainfall from very heavy rain days | 100*r99p / PRCPTOT | % | Ann |
| Standardised Precipitation Index | A measure of drought using the Standardised Precipitation Index on time scales of 3, 6, 12 and 24 months. See McKee et al. (1993) and the World Meteorological Organization SPI user guide (2012) for details. | unitless | Custom |
| Standardised Precipitation-Evapotranspiration Index | A measure of drought using the Standardised Precipitation-Evapotranspiration Index on time scales of 3, 6, 12 and 24 months. See Vicente-Serrano et al. (2010) for details. | unitless | Custom |
| Consecutive Wet Days | Maximum number of consecutive wet days (when PR >= 1.0 mm) | days | Ann |
| Standard Daily Intensity Index | Annual total rainfall on wet days (when total PR >= 1.0 mm) | mm/day | Ann |
| Highest rainfall | Maximum n-day rainfall total. Where n can be selected from 1 day, 3 days, or 5 days. | mm | Mon/Ann |
| Heatwave number | The number of heatwaves that occur annually. A heatwave is defined as 3 or more consecutive days where the Excess Heat Factor (EHF) is positive. See Nairn and Fawcett (2015) for details about the EHF. | Number of individual heatwaves events | Ann |
| Heatwave frequency | The number of days that contribute to heatwaves as identified by HWN. | days | Ann |
| Heatwave duration | The length of the longest heatwave. | days | Ann |
| Heatwave magnitude | The mean intensity of all heatwaves. | °C2 | Ann |
| Heatwave amplitude | The peak daily intensity in the heatwave with the highest average intensity. | °C2 | Ann |
Workshop posters
The following posters are often on display at workshops related to the CIPSA portal and may serve as useful references for users.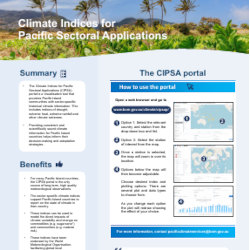
Methods
Quality control
Raw station data are collected from Pacific Island NMHS'. In some cases this data has undergone quality control by the respective NMHS. Regardless, basic quality control checks based are performed by COSPPac using the Climpact software. These include checks for:
- Instances of minimum temperature exceeding maximum temperature.
- Negative rainfall.
- Extremely large rainfall accumulations and verifying/correcting where possible.
- Extremely high or low temperatures and verifying/correcting where possible.
- Long series of constant temperatures and non-zero rainfall days.
See section 6 of the Climpact user guide for more information on the checks performed by Climpact.
Homogenisation
Homogenisation is the process of removing changes in a timeseries that are not related to changes in climate. Such changes are termed inhomogeneities and are usually the result of station relocations, instrument errors or changes, and changes in site exposure, though there are many other sources of inhomogeneity. Homogenisation should only be conducted on high quality, long and complete time series.
The process of homogenisation is complicated and made more so in the Pacific by the small number of stations that can be used as reference series, as well as by the generally low availability of station metadata. Rainfall data is tested for homogeneity, but no adjustments are applied when inhomogeneities are found. This is due to the higher variability of rainfall which leads to large uncertainties in determining the date and size of inhomogeneities. For more details see previous publications on the homogenisation of temperature and rainfall data in the Pacific (McGree et al., 2019; McGree et al., 2014; Whan et al., 2014; Jones et al., 2013; Folland et al., 2003; Salinger et al., 1995).
Percentile calculations
Many of the climate extremes indices presented on the CIPSA portal use percentile-based thresholds to calculate the amount of time that a threshold is exceeded (e.g. the TX90p index counts the percent of days where maximum temperature is warmer than the 90th percentile). However, it is not possible to make an accurate estimate of percentile thresholds both inside and outside of the base period using standard methods due to sampling uncertainty. To provide a temporally consistent estimate of the exceedance rate throughout the base period and out-of-base period the procedure of Zhang et al. (2005) is used to estimate exceedance rates. This method is used for all indices except WSDI, CSDI, and the heatwave indices, for which standard percentiles are used.
Base periods
Climate extremes indices that rely on percentile-based thresholds use the 1961-1990 base period. This follows guidance by the World Meteorological Organisation that long term climate change assessments use the 1961-1990 period, whereas climate monitoring use the most recent 30 year period finishing with a year ending in zero as a base period (i.e. 1991-2020).
Trends
Linear trends are plotted for most time series on the portal. These trends are calculated using Sen's slope. The Sen's slope is used as it is robust to outliers in the data.
In this portal, trend lines are sometimes described as 'statistically significant at the 95% level'. A trend is considered statistically significant if we are confident that it is genuinely increasing or decreasing. Specifically, when a trend is statistically significant at the 95% level it means that if there is no actual underlying change occurring in the data then there would be less than a 5% probability of observing a trend as extreme as yours. In other words, the trend is unlikely to have occurred by chance.
Data completeness criteria
Calculating reliable temperature and rainfall trends requires timeseries that have minimal missing values. For trends to be calculated on the CIPSA portal, at least 25 years of data is required with no more than 20% of years missing.
In most cases, the monthly data on the CIPSA portal has been calculated from corresponding daily data. In these cases a maximum of 5 missing days has been allowed for the derivation of monthly values. Seasonal and annual values are subsequently calculated from monthly values with no missing months allowed.
For the calculation of climate extremes indices stricter missing data criteria are applied since extreme values can be sensitive to missing data. Climate extremes indices are calculated at monthly and annual frequencies. Indices are not calculated for any month with more than 3 missing days and are not calculated for any year with more than 15 missing days. Furthermore, years with a missing month do not have climate extremes calculated either. This can result in many missing months or years in timeseries that have a substantial amount of data, but this approach ensures strict standards in statistical sample size are adhered to, thus improving the reliability of the results.
Data Access
The data and analyses presented here are based on data collected, maintained and owned by Pacific Island NMHS'. Please contact the relevant NMHS for access to restricted data underlying the plots on this website.
No part of these analyses may be reproduced or redistributed for any commercial purposes. Any use of these analyses should acknowledge the Bureau of Meteorology, COSPPac and the relevant Pacific Island NMHS.
Download Source Code
The source code for the CIPSA portal is available under the Apache License 2.0. Download the latest release.
This package contains the application source code but excludes sensitive files, test data, proprietary vendor libraries, and AWS deployment scripts. The software is licensed under the Apache License 2.0. This licence does not apply to third-party vendor libraries.
Further Information
For all queries related to the Climate Indices for Pacific Sectoral Applications Portal please email pacificlimateservices@bom.gov.au.